Overview
Cytoscape.js is a powerful open-source JavaScript library used for visualizing and analyzing graph-based data. It allows developers to create interactive, customizable, and scalable network visualizations in web applications. The library is part of the larger Cytoscape ecosystem, which includes the Cytoscape desktop application for bioinformatics and other graph-related analyses.
Built on modern web technologies, Cytoscape.js supports dynamic graph manipulation, animations, user interactions, and various layout algorithms. It is widely used in fields like bioinformatics, social network analysis, and data visualization.
Purpose of Cytoscape.js
The primary purpose of Cytoscape.js is to enable developers to easily create, manipulate, and visualize complex networks in web applications. Some key objectives include:
- Graph Visualization – Display large-scale networks interactively.
- Customization – Offers extensive styling and layout options for graphs.
- Interactivity – Supports user interactions like zooming, panning, and selecting nodes/edges.
- Algorithm Support – Includes built-in layout and graph analysis algorithms.
- Performance – Optimized for handling large graphs efficiently.
- Integration – Can be used with various frameworks (React, Angular, Vue) and other libraries like D3.js.
Installing and Configuring Cytoscape.js
1. Using via CDN (Recommended for Quick Use)
The easiest way to use Cytoscape.js in a web project is by including it via a CDN.
<script src="https://unpkg.com/cytoscape@3.28.0/dist/cytoscape.min.js"></script>2. Installing via NPM (For Node.js & Modern Web Apps)
If you’re working with Node.js, React, or other modern frameworks, installing via npm is recommended.
npm install cytoscape3. Using Cytoscape.js with ES Modules
If your project supports ES Modules, you can directly import Cytoscape.js.
import cytoscape from 'https://unpkg.com/cytoscape@3.28.0/dist/cytoscape.esm.min.js';
console.log(cytoscape);
Key Features and Explanation
1️⃣ Graph Visualization & Layouts
- Supports various graph layouts (grid, circle, breadth-first, etc.).
- Provides real-time updates and animations.
🌿 Example 1: Draggable Node
            <!DOCTYPE html>
            <html lang="en">
            <head>
            <script src="https://cdnjs.cloudflare.com/ajax/libs/cytoscape/3.24.0/cytoscape.min.js"></script>
            <style> #cy { width: 100%; height: 500px; border: 1px solid black; } </style>
            </head>
            <body>
                <div id="cy"></div>
                <script>
                    document.addEventListener("DOMContentLoaded", function() {
                        var cy = cytoscape({
                            container: document.getElementById('cy'),
                            elements: [
                                { data: { id: 'A' }, position: { x: 100, y: 200 } },
                                { data: { id: 'B' }, position: { x: 300, y: 100 } },
                                { data: { id: 'C' }, position: { x: 500, y: 200 } },
                                { data: { id: 'AB', source: 'A', target: 'B' } },
                                { data: { id: 'BC', source: 'B', target: 'C' } },
                                { data: { id: 'CA', source: 'C', target: 'A' } }
                            ],
                            style: [{ selector: 'node', style: { 'background-color': '#007bff', 'label': 'data(id)', 'color': '#fff' } }],
                            layout: { name: 'preset' }
                        });
                        cy.nodes().forEach(node => node.grabbable(true));
                    });
                </script>
            </body>
            </html>
Explanation: The code creates an interactive graph using Cytoscape.js, displaying three nodes (A, B, C) connected by edges in a triangular layout. Nodes are blue with white labels, and edges are gray with arrows. The graph allows dragging nodes, as well as zooming and panning for better exploration. The layout is preset, meaning nodes start at fixed positions but can be moved freely.
🌿 Example 2: Adding and Removing Nodes
            <!DOCTYPE html>
            <html lang="en">
            <head>
                <script src="https://cdnjs.cloudflare.com/ajax/libs/cytoscape/3.21.0/cytoscape.min.js"></script>
                <style> #cy { width: 100%; height: 500px; border: 1px solid black; } </style>
            </head>
            <body>
                <button onclick="addNode()">Add Node</button>
                <button onclick="removeNode()">Remove Node</button>
                <div id="cy"></div>
                <script>
                    let count = 1;
                    let cy = cytoscape({
                        container: document.getElementById('cy'),
                        elements: [{ data: { id: 'A' } }],
                        style: [{ selector: 'node', style: { 'background-color': 'green', 'label': 'data(id)', 'color': 'white' } }],
                        layout: { name: 'grid' }
                    });

                    function addNode() {
                        let newId = 'N' + count++;
                        cy.add({ data: { id: newId } });
                        cy.layout({ name: 'grid', animate: true }).run();
                    }

                    function removeNode() {
                        let nodes = cy.nodes();
                        if (nodes.length > 0) nodes[nodes.length - 1].remove();
                    }
                </script>
            </body>
            </html>
Explanation: The code creates a dynamic interactive graph using Cytoscape.js, allowing users to add and remove nodes dynamically.
- Graph Container: A div (#cy) displays the graph.
- Initial Setup: The graph starts with one green node (“A”) in a grid layout.
- Buttons for Interaction:
- “Add Node”: Adds a new node (N1, N2, ...) with a unique ID and re-arranges the layout.
- “Remove Node”: Deletes the last-added node.
- Styling: Nodes are green with white labels.
- Interactivity: Users can dynamically modify the graph by adding or removing nodes, and the layout updates automatically.
🌿 Example 3: Dynamic Switching Between Different Layouts
            <!DOCTYPE html>
            <html lang="en">
            <head>
                <script src="https://unpkg.com/cytoscape/dist/cytoscape.min.js"></script>
                <style>
                    #cy { width: 90vw; height: 70vh; border: 2px solid #ccc; background: white; }
                </style>
            </head>
            <body>
                <button onclick="setLayout('grid')">Grid</button>
                <button onclick="setLayout('circle')">Circular</button>
                <button onclick="setLayout('breadthfirst')">Linear</button>
                <div id="cy"></div>

                <script>
                    let cy = cytoscape({
                        container: document.getElementById('cy'),
                        elements: [
                            // Nodes
                            { data: { id: 'A' } }, { data: { id: 'B' } }, { data: { id: 'C' } },
                            { data: { id: 'D' } }, { data: { id: 'E' } }, { data: { id: 'F' } },
                            { data: { id: 'G' } }, { data: { id: 'H' } }, { data: { id: 'I' } },
                            { data: { id: 'J' } },

                            // Edges
                            { data: { source: 'A', target: 'B' } },
                            { data: { source: 'B', target: 'C' } },
                            { data: { source: 'C', target: 'D' } },
                            { data: { source: 'D', target: 'E' } },
                            { data: { source: 'E', target: 'F' } },
                            { data: { source: 'F', target: 'G' } },
                            { data: { source: 'G', target: 'H' } },
                            { data: { source: 'H', target: 'I' } },
                            { data: { source: 'I', target: 'J' } },
                            { data: { source: 'J', target: 'A' } } // Completing the loop
                        ],
                        style: [{
                            selector: 'node',
                            style: {
                                'background-color': '#007bff',
                                'label': 'data(id)',
                                'color': '#fff'
                            }
                        }],
                        layout: { name: 'grid' }
                    });

                    function setLayout(layoutName) {
                        cy.layout({ name: layoutName }).run();
                    }
                </script>
            </body>
            </html>
Explanation: The code creates an interactive graph using Cytoscape.js, allowing users to switch between different node layouts dynamically.
- Graph Setup:
- Contains 8 nodes (A to H) connected by edges.
- Nodes are blue with white labels and circular in shape.
- Edges are gray with arrowheads.
- Layout Switching:
- Three buttons allow users to change the node arrangement:
- Grid Layout
- Circular Layout
- Linear (Breadth-First) Layout
- Interactivity: Clicking a button updates the graph’s structure in real-time. 🚀
2️⃣ Interactive Graph with Click Events
- Click on a node to display an alert with its name.
- Nodes are styled with a blue background and white labels.
- Edges have arrows and are styled in gray.
Example: Clickable Nodes
            <!DOCTYPE html>
            <html lang="en">
            <head>
                <meta charset="UTF-8">
                <meta name="viewport" content="width=device-width, initial-scale=1.0">
                <title>Cytoscape.js Click Event Example</title>
                <script src="https://cdnjs.cloudflare.com/ajax/libs/cytoscape/3.24.0/cytoscape.min.js"></script>
                <style>
                    #cy {
                        width: 600px;
                        height: 400px;
                        border: 1px solid black;
                    }
                    h2 {
                        color: white; /* Change this to any color */
                    }

                </style>
            </head>
            <body>

                <h2>Cytoscape.js Click Event Example</h2>
                <div id="cy"></div>

                <script>
                    // Initialize Cytoscape
                    var cy = cytoscape({
                        container: document.getElementById('cy'), // Graph container

                        elements: [ // Define nodes and edges
                            { data: { id: 'A' } },
                            { data: { id: 'B' } },
                            { data: { id: 'C' } },
                            { data: { id: 'D' } },
                            { data: { id: 'E' } },
                            { data: { id: 'AB', source: 'A', target: 'B' } },
                            { data: { id: 'BC', source: 'B', target: 'C' } },
                            { data: { id: 'CD', source: 'C', target: 'D' } },
                            { data: { id: 'DE', source: 'D', target: 'E' } }
                        ],

                        style: [ // Styling for nodes and edges
                            {
                                selector: 'node',
                                style: {
                                    'background-color': '#3498db',
                                    'label': 'data(id)',
                                    'color': 'white',
                                    'text-valign': 'center',
                                    'text-halign': 'center',
                                    'font-size': '14px'
                                }
                            },
                            {
                                selector: 'edge',
                                style: {
                                    'width': 2,
                                    'line-color': '#95a5a6',
                                    'target-arrow-shape': 'triangle',
                                    'target-arrow-color': '#95a5a6'
                                }
                            }
                        ],

                        layout: {
                            name: 'grid',
                            rows: 2
                        }
                    });

                    // Click event listener for nodes
                    cy.on('tap', 'node', function(evt){
                        var node = evt.target;
                        alert('You clicked on ' + node.id());
                    });
                </script>

            </body>
            </html>
Explanation:
- Cytoscape.js Library: Included via CDN (`cytoscape.min.js`).
- Graph Container: The `` holds the graph.
- Graph Elements: Nodes (A–E) and edges are pre-defined.
- Styling: Blue nodes with white text, gray edges with arrows.
- Layout: Uses a **grid layout** for organized node placement.
- Click Event (tap): Clicking a node triggers an **alert** showing its ID.
3️⃣ Animated Force-Directed Layout
🎢 Nodes naturally spread out using a physics-based force-directed layout.
            <!DOCTYPE html>
            <html lang="en">
            <head>
                <meta charset="UTF-8">
                <meta name="viewport" content="width=device-width, initial-scale=1.0">
                <title>Cytoscape.js CoSE Layout</title>
                <script src="https://cdnjs.cloudflare.com/ajax/libs/cytoscape/3.24.0/cytoscape.min.js"></script>
                <style>
                    #cy {
                        width: 600px;
                        height: 400px;
                        border: 1px solid black;
                    }
                    h2 {
                        color: white; /* Change this to any color */
                    }
                </style>
            </head>
            <body>

                <h2>Cytoscape.js CoSE Layout Example</h2>
                <div id="cy"></div>

                <script>
                    // Initialize Cytoscape
                    var cy = cytoscape({
                        container: document.getElementById('cy'), // Graph container

                        elements: [ // Nodes and edges
                            { data: { id: 'A' } },
                            { data: { id: 'B' } },
                            { data: { id: 'C' } },
                            { data: { id: 'D' } },
                            { data: { id: 'E' } },
                            { data: { id: 'AB', source: 'A', target: 'B' } },
                            { data: { id: 'BC', source: 'B', target: 'C' } },
                            { data: { id: 'CD', source: 'C', target: 'D' } },
                            { data: { id: 'DE', source: 'D', target: 'E' } }
                        ],

                        style: [ // Styling nodes and edges
                            {
                                selector: 'node',
                                style: {
                                    'background-color': '#e74c3c',
                                    'label': 'data(id)',
                                    'color': 'white',
                                    'text-valign': 'center',
                                    'text-halign': 'center',
                                    'font-size': '14px'
                                }
                            },
                            {
                                selector: 'edge',
                                style: {
                                    'width': 2,
                                    'line-color': '#2c3e50',
                                    'target-arrow-shape': 'triangle',
                                    'target-arrow-color': '#2c3e50'
                                }
                            }
                        ]
                    });

                    // Apply CoSE Layout
                    cy.layout({
                        name: 'cose', // Force-directed layout
                        animate: true // Animates the layout transition
                    }).run();
                </script>

            </body>
            </html>
Explanation of the Code:
- 1️⃣ Cytoscape Initialization (`cytoscape({...})`):
- Creates a graph with a set of **nodes** and **edges**.
- Nodes are labeled with their **IDs** and styled with **red backgrounds**.
- Edges are styled with a **dark gray color** and **arrowheads**.
- 2️⃣ Applying the CoSE Layout (`cy.layout({...}).run()`):
- The **CoSE (Compound Spring Embedder) layout** is a **force-directed layout**.
- It automatically **arranges nodes in an organic manner**.
- `animate: true` enables **smooth transitions** when applying the layout.
- 3️⃣ Why Use CoSE Layout?
- Unlike **grid** or **circle** layouts, **CoSE dynamically arranges nodes** based on **physics-like forces** (spring forces between connected nodes).
- It is **ideal for large graphs** because it **minimizes edge crossings**.
4️⃣ Styling Nodes Based on Data Properties
🎨 Change node color dynamically using JSON data.
            <script>
                cy.style().selector('node').style({
                    'background-color': function(ele){
                        return ele.data('id') === 'A' ? 'red' : 'green';
                    }
                }).update();
            </script>
✨ Output:
- 🔴 **Node A turns red**, while all other nodes remain **green**.
- 🎯 Great for **highlighting important elements dynamically**.
5️⃣ Export Graph as an Image
📸 Save the graph as a PNG image with a button click.
            <script>
                function download() {
                    var png = cy.png(); // Get PNG data
                    var link = document.createElement('a');
                    link.setAttribute('href', png);
                    link.setAttribute('download', 'graph.png');
                    link.click();
                }
            </script>
✨ Output:
- 📥 Clicking the button **downloads the current graph as an image**.
- 📊 Perfect for **report generation and presentations**.
Use Cases
🔬 Biological & Biomedical Network Analysis
- ✅ Protein-protein interaction (PPI) visualization
- ✅ Metabolic pathways and gene regulatory networks
- ✅ Disease-gene association studies in bioinformatics
🌐 Social Network Analysis
- ✅ Mapping relationships between users in social media
- ✅ Identifying influential nodes using centrality measures
- ✅ Studying online communities and behavior patterns
🧠 Knowledge Graphs & Semantic Web
- ✅ Visualizing knowledge graphs (e.g., Wikidata, DBpedia)
- ✅ Browsing linked data and ontology structures
- ✅ Representing entity relationships in AI & NLP applications
🔐 IT & Cybersecurity
- ✅ Mapping computer networks & cloud architectures
- ✅ Analyzing cyberattack patterns & threat intelligence
- ✅ Visualizing blockchain networks & smart contracts
🚗 Pathfinding & Graph Algorithms
- ✅ Implementing shortest path algorithms (Dijkstra, A*)
- ✅ Analyzing transportation networks (roads, railways, flights)
- ✅ Optimizing logistics & supply chain operations
📊 Business Intelligence & Organizational Mapping
- ✅ Representing organizational hierarchies & workflows
- ✅ Analyzing customer relationships & marketing strategies
- ✅ Detecting fraud in financial transaction networks
🤖 Data Science & Machine Learning
- ✅ Visualizing decision trees, neural networks, and clustering results
- ✅ Exploring high-dimensional data using graph-based visualization
- ✅ Understanding feature relationships in predictive models
⚛ Physics & Chemistry Simulations
- ✅ Modeling atomic structures & molecular interactions
- ✅ Visualizing forces & energy distributions in physics research
- ✅ Simulating ecological or climate networks
A Real-Life Example
                    <!DOCTYPE html>
                    <html lang="en">
                    <head>
                        <meta charset="UTF-8">
                        <meta name="viewport" content="width=device-width, initial-scale=1.0">
                        <title>Interactive Cytoscape Graph</title>
                        <script src="https://cdnjs.cloudflare.com/ajax/libs/cytoscape/3.25.0/cytoscape.min.js"></script>
                        <style>
                            body { font-family: Arial, sans-serif; }
                            #cy { width: 100%; height: 500px; border: 1px solid black; }
                            .tooltip {
                                position: absolute;
                                background: rgba(0, 0, 0, 0.7);
                                color: white;
                                padding: 5px;
                                border-radius: 5px;
                                font-size: 12px;
                                display: none;
                            }
                            h2 {
                                color: white; /* Change this to any color */
                            }
                        </style>
                    </head>
                    <body>

                        <h2>Interactive Cytoscape.js Graph</h2>
                        <div id="cy"></div>

                        <script>
                            let cy = cytoscape({
                                container: document.getElementById('cy'),
                                elements: generateRandomGraph(20, 40),
                                style: [
                                    { selector: 'node', style: { 'background-color': '#007bff', 'label': 'data(label)', 'font-size': '12px', 'text-valign': 'center', 'color': 'white', 'text-outline-width': 2, 'text-outline-color': 'black', 'width': '40px', 'height': '40px', 'shape': 'ellipse', 'border-width': 2, 'border-color': '#000' } },
                                    { selector: 'node.hovered', style: { 'background-color': 'green', 'width': '50px', 'height': '50px', 'border-width': 4, 'border-color': 'rgba(0, 255, 0, 0.8)' } },
                                    { selector: 'edge', style: { 'line-color': '#ccc', 'width': 'mapData(weight, 1, 10, 2, 8)', 'curve-style': 'bezier', 'label': 'data(weight)', 'font-size': '10px', 'text-outline-width': 2, 'text-outline-color': 'white' } },
                                    { selector: ':selected', style: { 'border-width': 3, 'border-color': 'red' } },
                                    { selector: '.highlighted', style: { 'background-color': 'yellow', 'line-color': 'yellow', 'transition-duration': '0.5s' } }
                                ],
                                layout: { name: 'cose', animate: true }
                            });

                            function generateRandomGraph(nodeCount, edgeCount) {
                                let nodes = [], edges = [];
                                for (let i = 0; i < nodeCount; i++) {
                                    nodes.push({ data: { id: `S${i}`, label: `Sector ${i+1}` } });
                                }
                                for (let i = 0; i < edgeCount; i++) {
                                    let src = `S${Math.floor(Math.random() * nodeCount)}`;
                                    let tgt = `S${Math.floor(Math.random() * nodeCount)}`;
                                    if (src !== tgt) edges.push({ data: { id: `${src}-${tgt}`, source: src, target: tgt, weight: Math.floor(Math.random() * 10) + 1 } });
                                }
                                return { nodes, edges };
                            }
                        </script>

                    </body>
                    </html>
The provided Cytoscape.js code creates an interactive graph visualization where nodes represent different “sectors” and edges represent weighted connections between them. This visualization can be applied in various real-world scenarios such as:
- Supply Chain Management:
- ✅ Each node represents a distribution center, and edges denote transportation routes.
- ✅ The shortest path feature helps identify the quickest delivery route between two centers.
- Social Network Analysis:
- ✅ Nodes represent individuals, and edges represent their relationships.
- ✅ The clustering algorithm groups users into communities based on common connections.
- Cybersecurity & Threat Detection:
- ✅ Nodes symbolize servers or devices in a network, while edges denote data flows.
- ✅ The Depth-First Search (DFS) traversal helps analyze network vulnerabilities.
- Smart City Traffic Management:
- ✅ Each node represents a city zone, and edges indicate roads with traffic weights.
- ✅ The interactive highlighting of routes enables better traffic flow analysis.
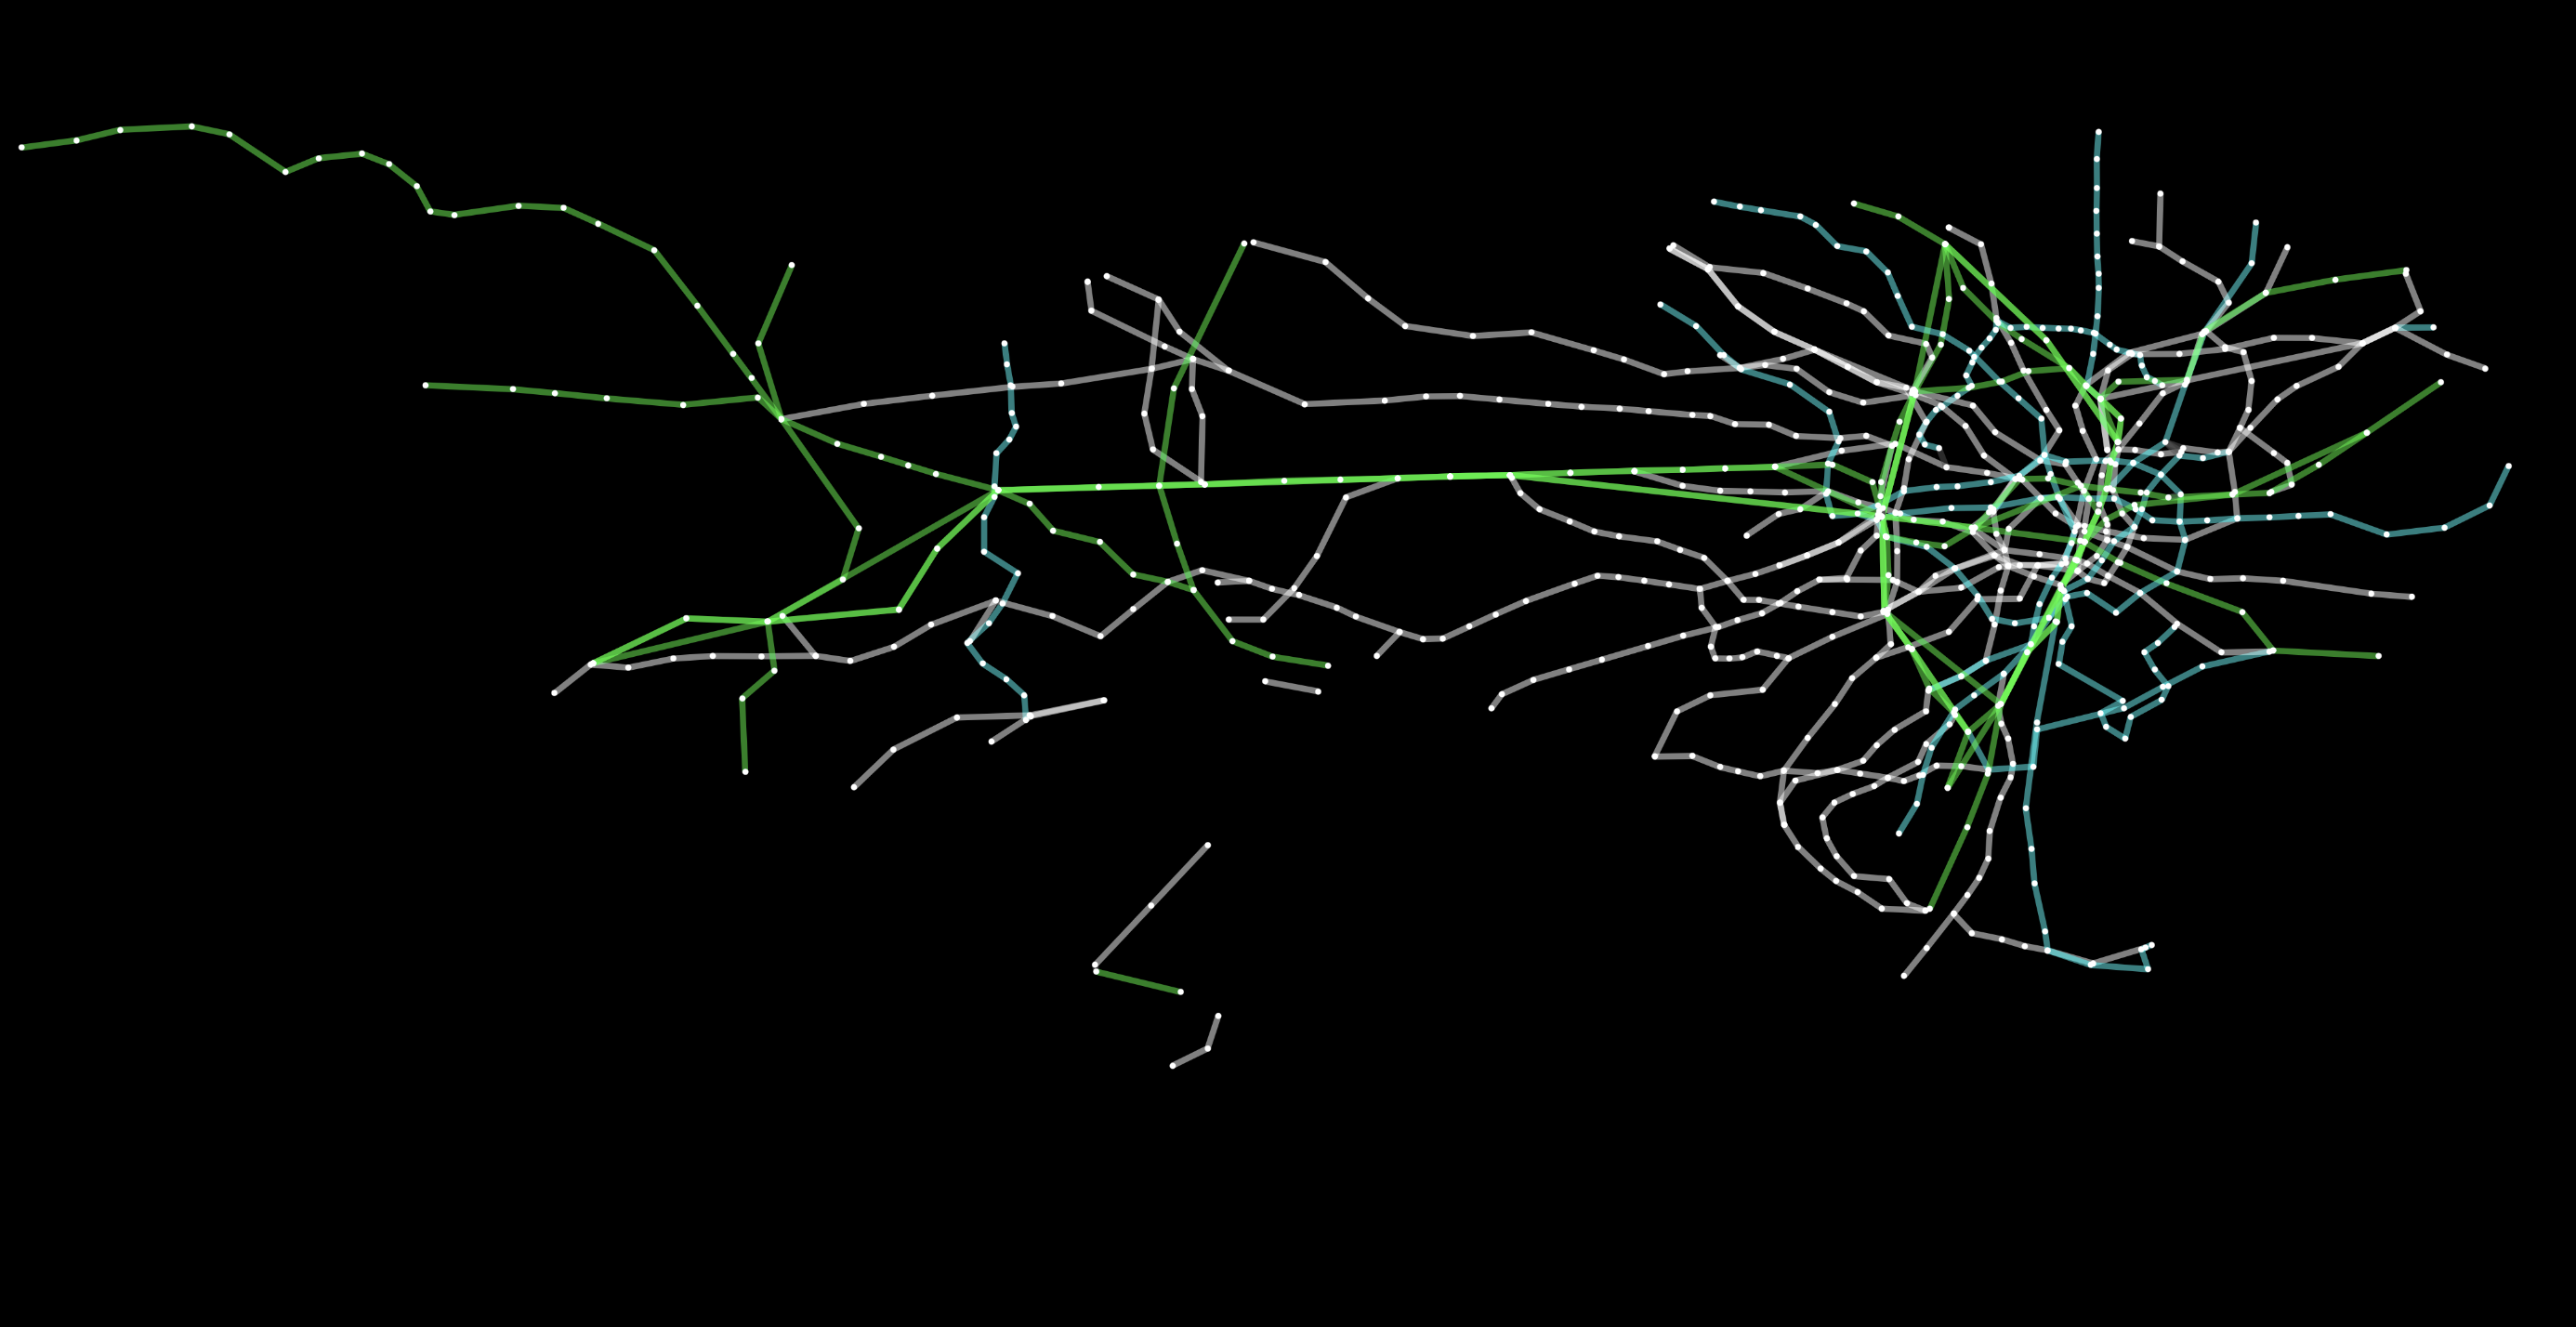
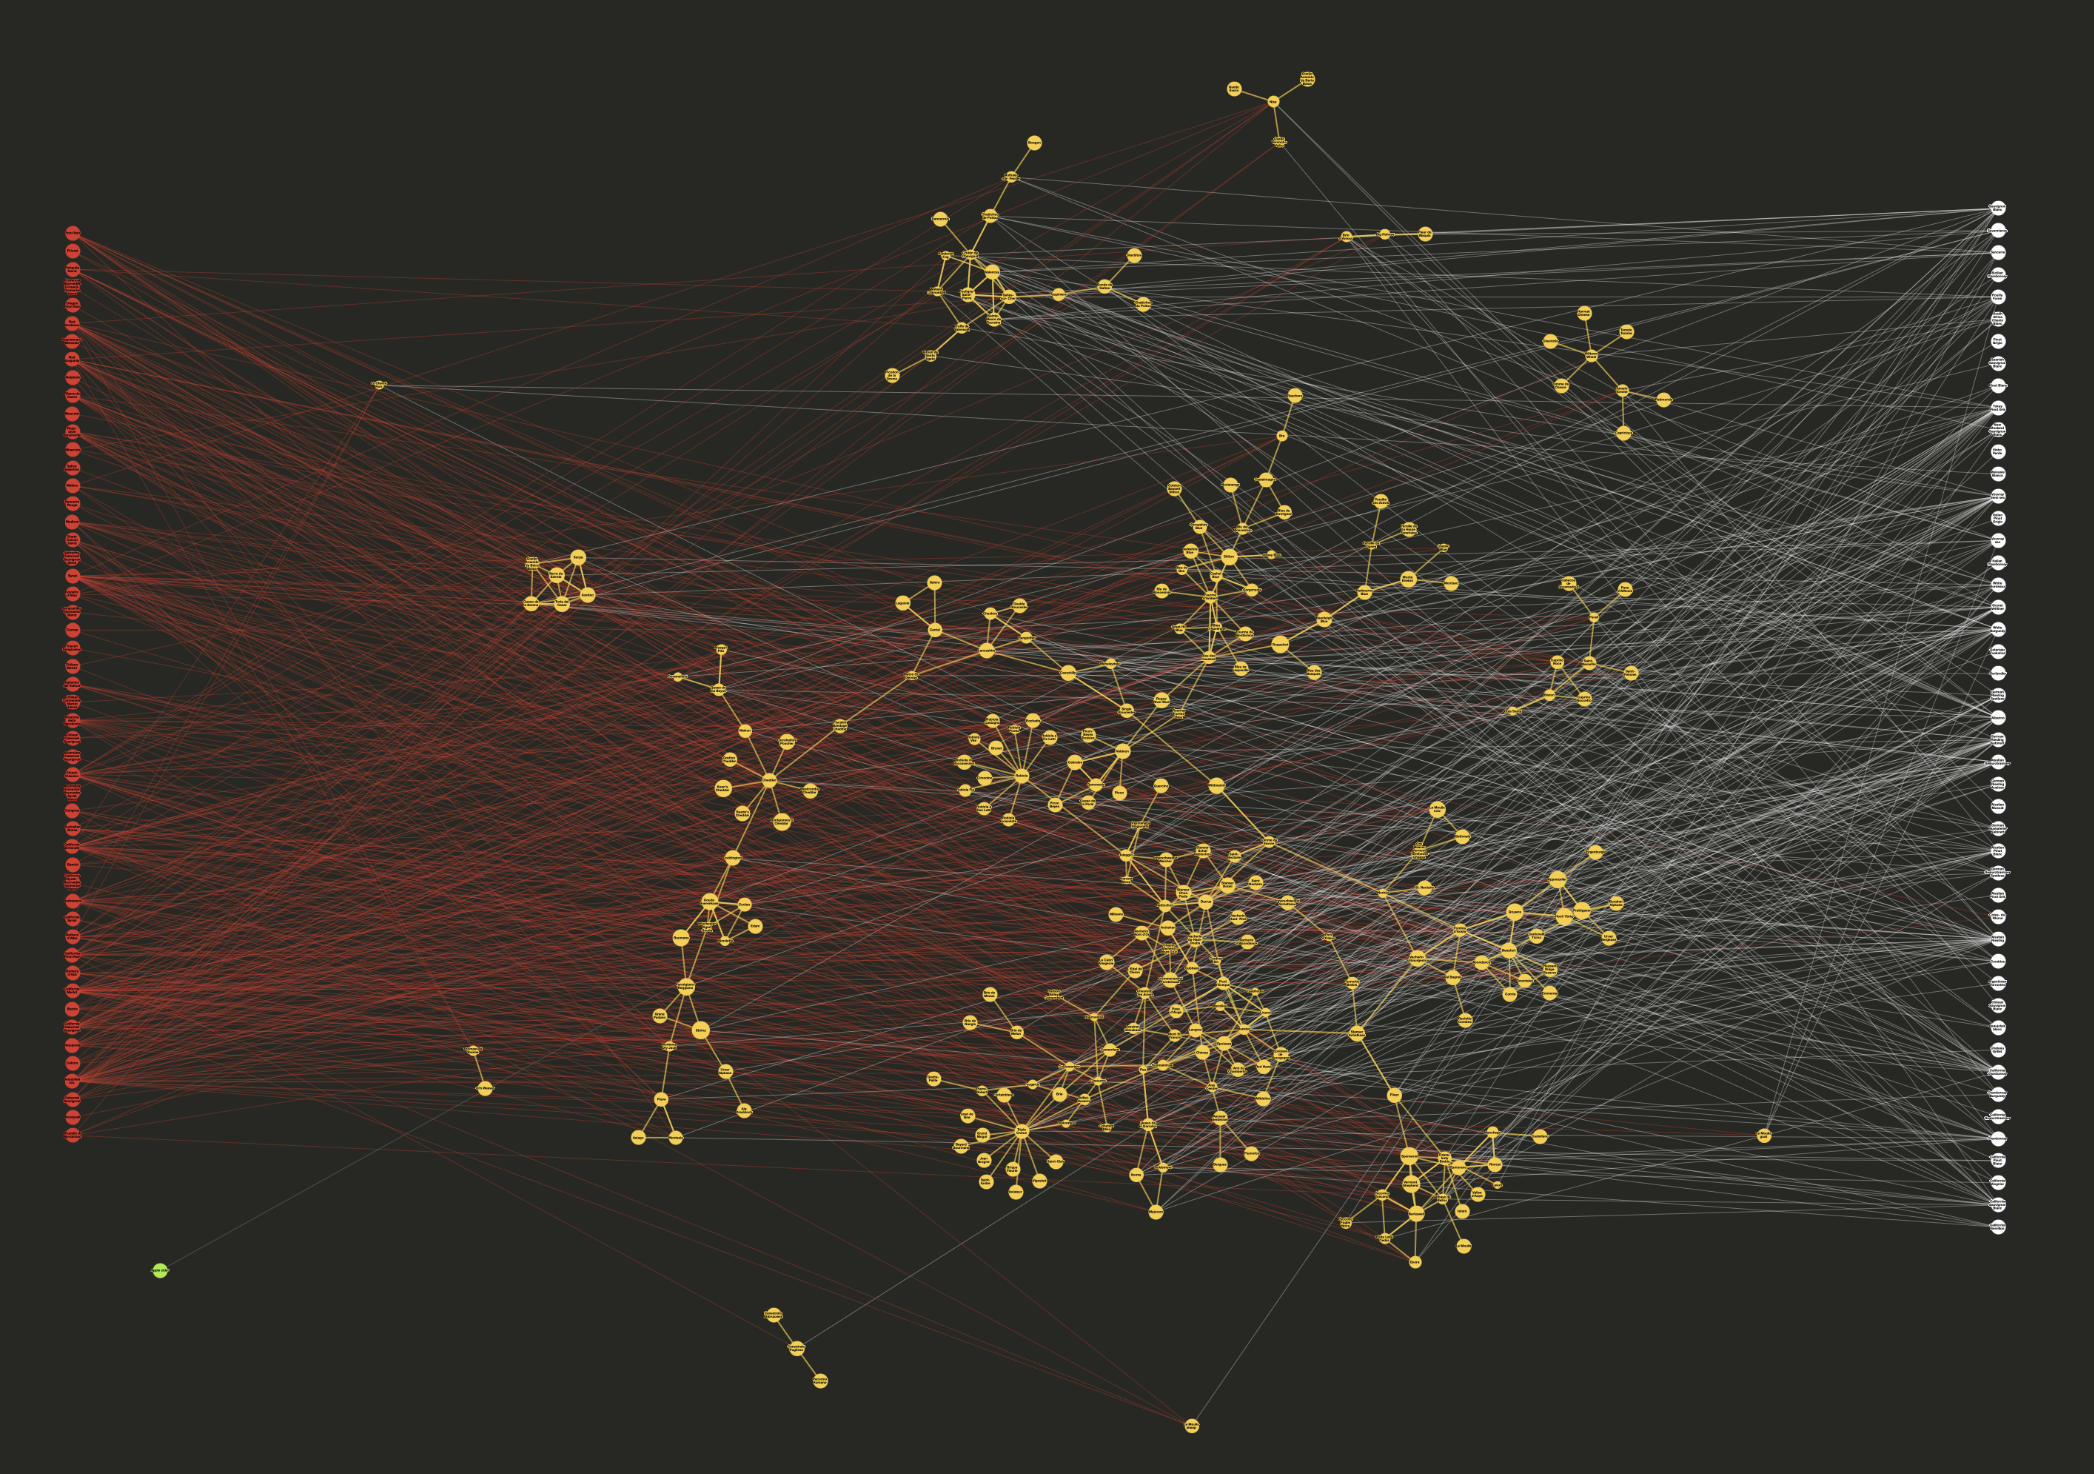
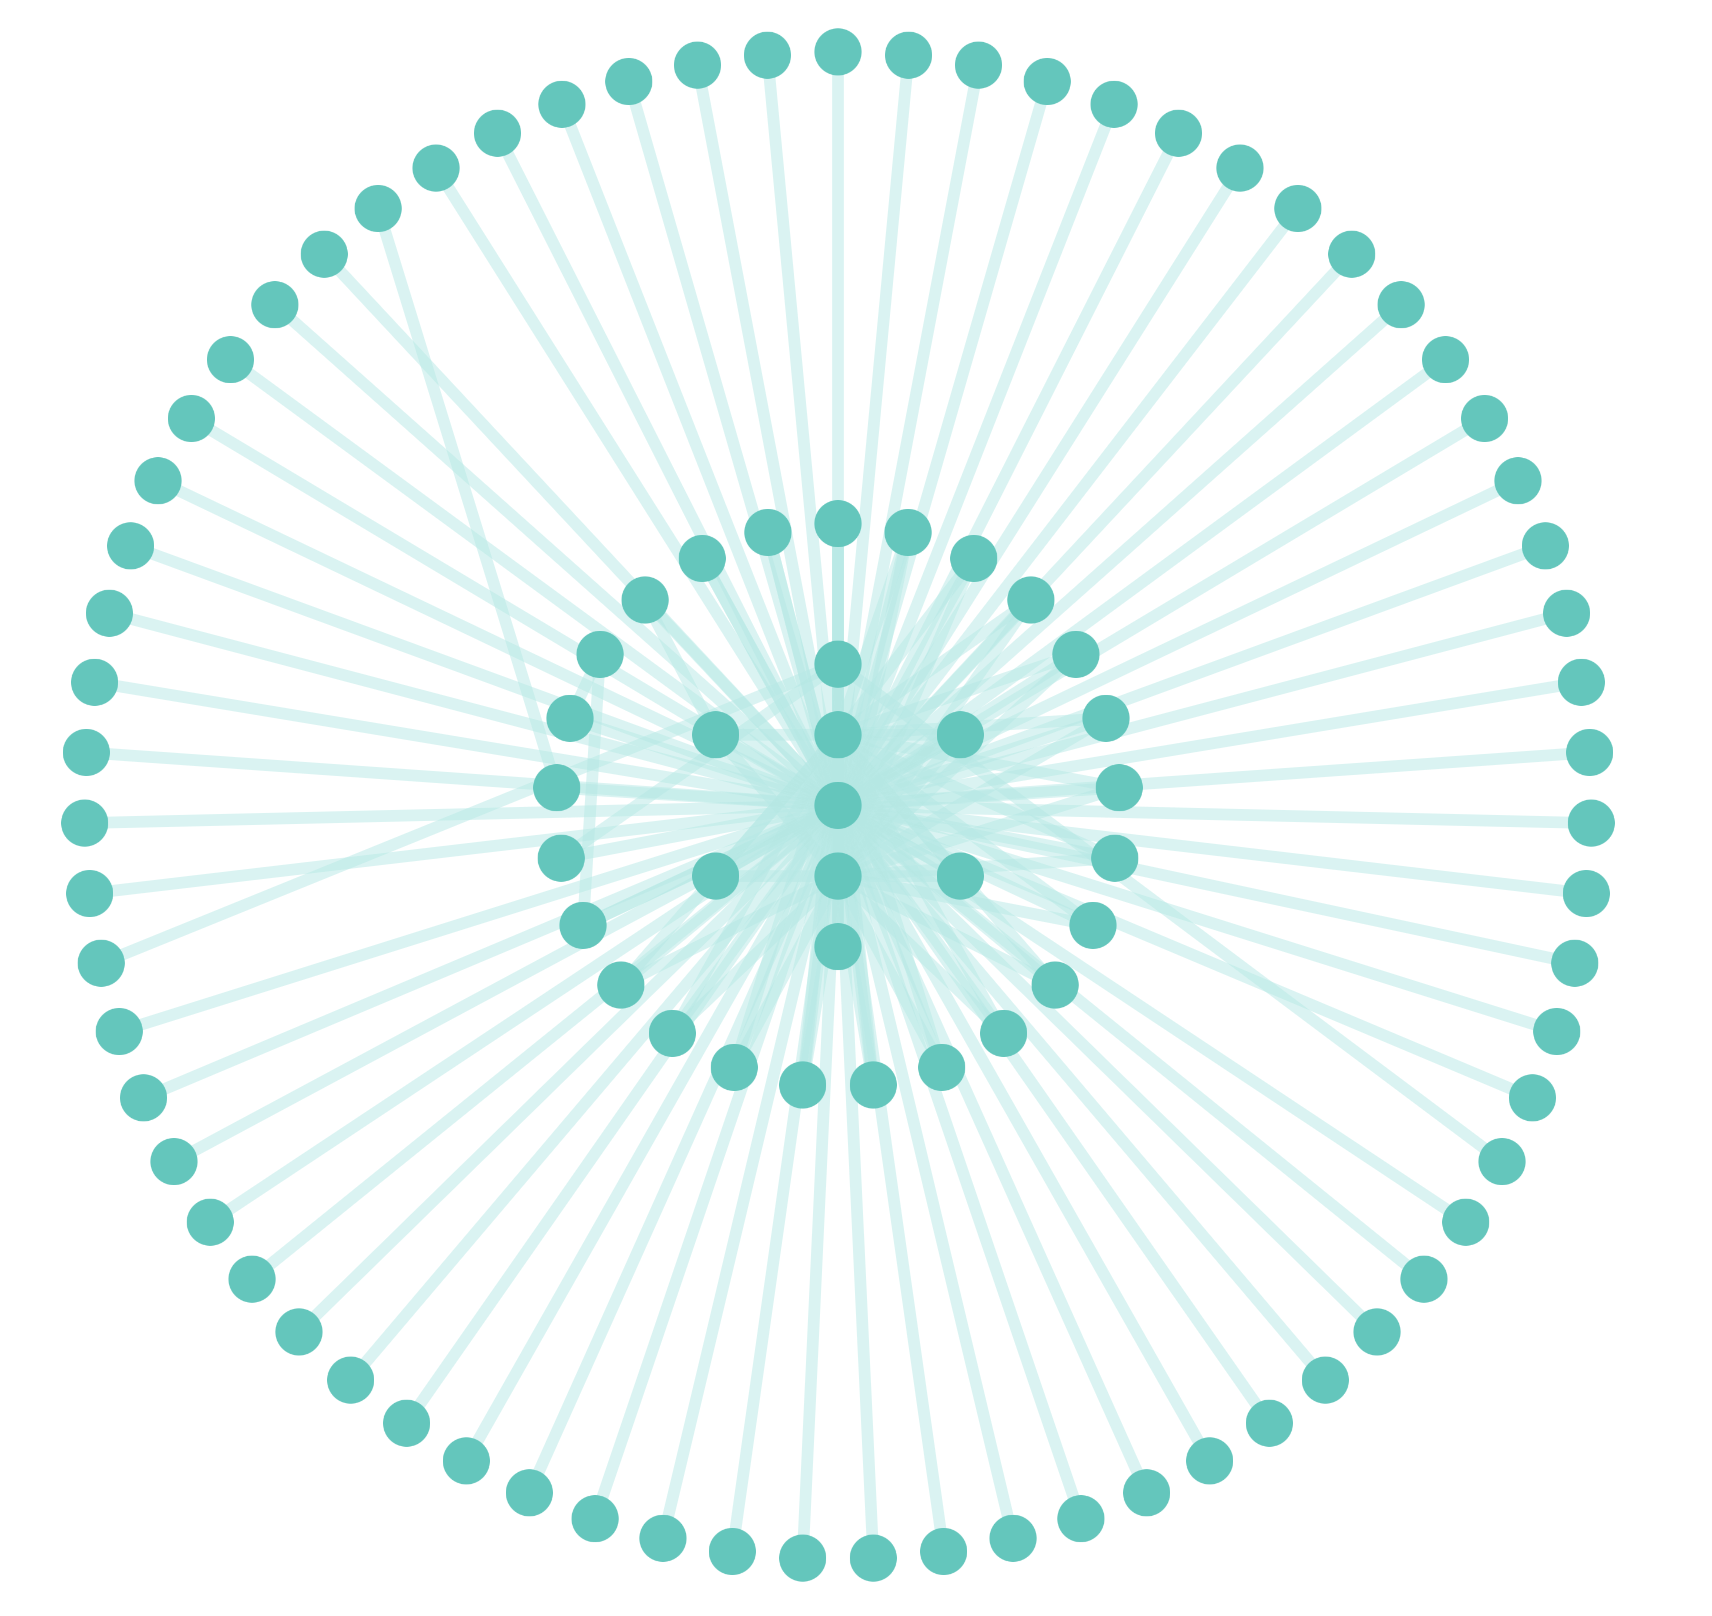
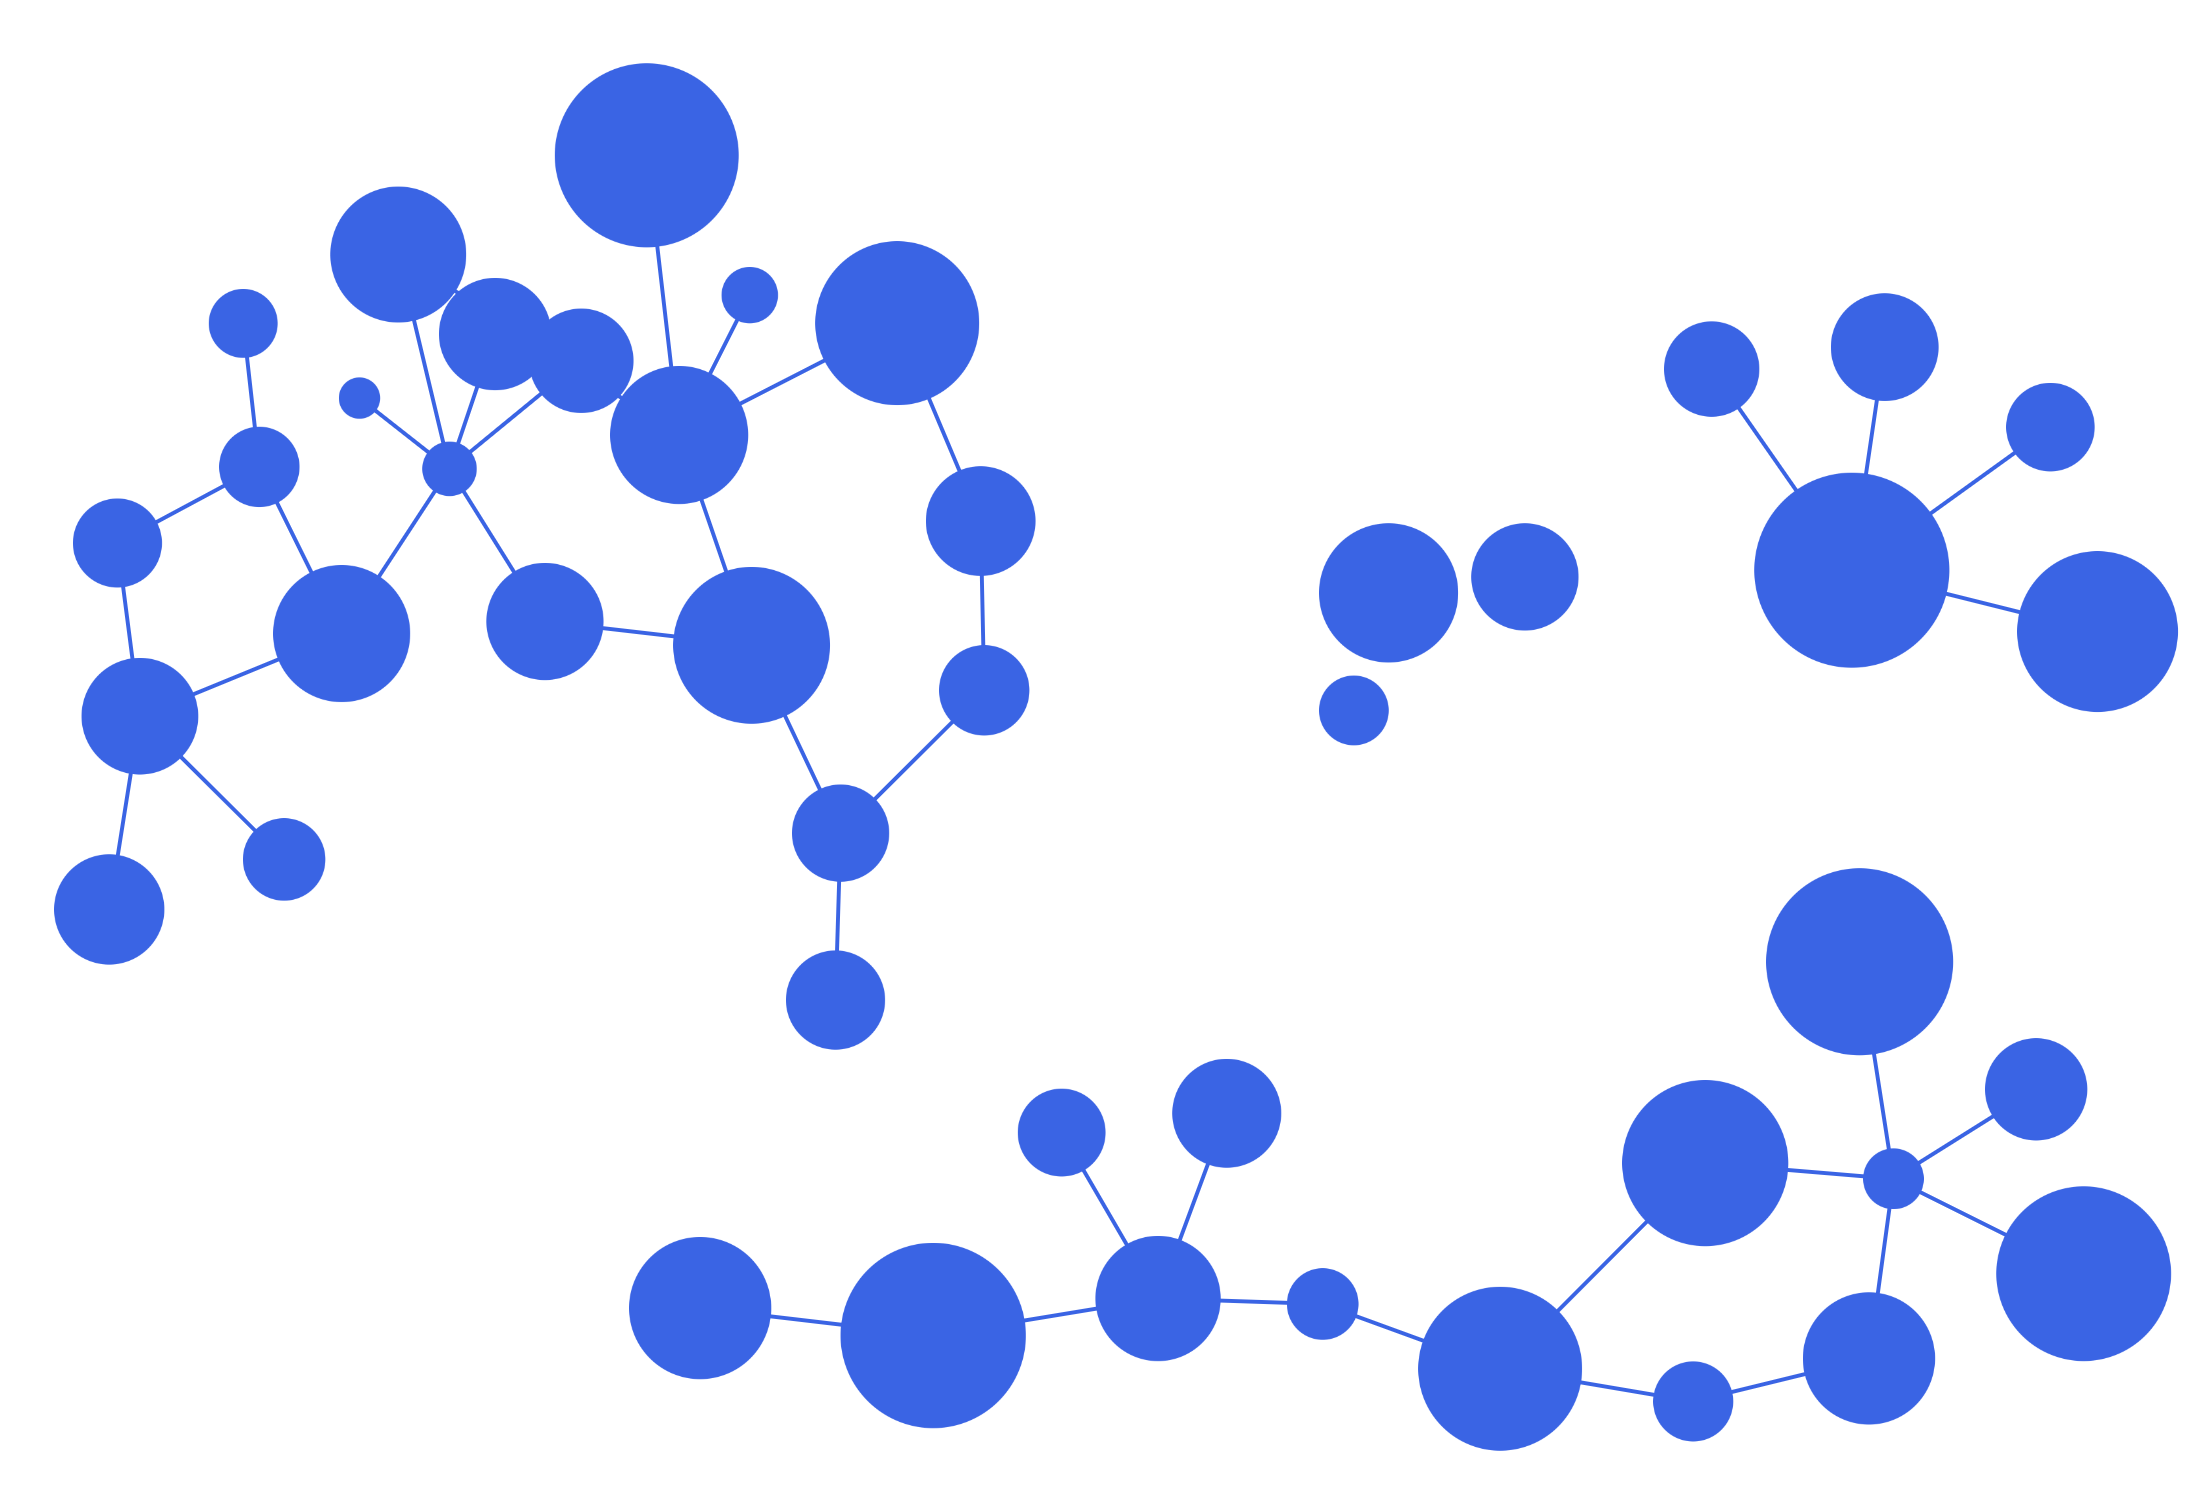
Cytoscape.js Demos
Click on the images to view the demo.
Conclusion
Cytoscape.js proves to be a powerful and flexible library for network visualization, offering dynamic interactions, real-time analysis, and algorithmic computations like shortest path detection, clustering, and graph traversal. Whether used in scientific research, business intelligence, or urban planning, its versatility makes it an invaluable tool for visualizing complex relationships in a user-friendly and interactive manner.
With this foundation, developers can extend the visualization further by integrating real-time data, customizing layouts, or adding AI-driven insights, making network analysis even more insightful and impactful.
References
-
Cytoscape.js Official Documentation
https://js.cytoscape.org/
(Primary source for all functionalities and examples.) -
Cytoscape.js GitHub Repository
https://github.com/cytoscape/cytoscape.js
(For the latest updates, issues, and contributions.) -
Cytoscape.js Tutorials
https://js.cytoscape.org/#tutorials
(Official tutorials covering layouts, styles, and advanced features.) -
MDN Web Docs – JavaScript & DOM Manipulation
https://developer.mozilla.org/en-US/docs/Web/JavaScript
(Useful for understanding JavaScript concepts related to Cytoscape.js.) -
Stack Overflow – Cytoscape.js Questions
https://stackoverflow.com/questions/tagged/cytoscape.js
(For troubleshooting and community solutions.)